Accessibility
Skip to content
High contrast
High contrast
Partnership Planner
Research
Submit Content
Login
High contrast
High contrast
Partner with us
Research & insights
Our impact
Resources
About us
Submit content and ideas
Newsletter sign up
Order visitors guides
Login
LinkedIn
Facebook
Featured
Enhance your advertising with the Global Leveraged Media Co-op
Back to main menu
Partner with us
Partnership Planner
Submit Content
Submit a business listing
Submit consumer content
Submit PR content - pitches and leads
Submit PR content - What's New
Featured
Feature content on the California Now Network
Back to main menu
Research & insights
Research dashboard
Research catalog
Airport Passenger Traffic
Economic Impact of Travel
Global Market Profiles
International Arrivals
International Market Share
Lodging Performance
Non-Stop Airlift
Resident Sentiment
State and Regional Lodging Forecast
Travel Indicators Summary
Visitation and Spend Forecast
Featured
Access more than $2 million in research data and insights at no cost
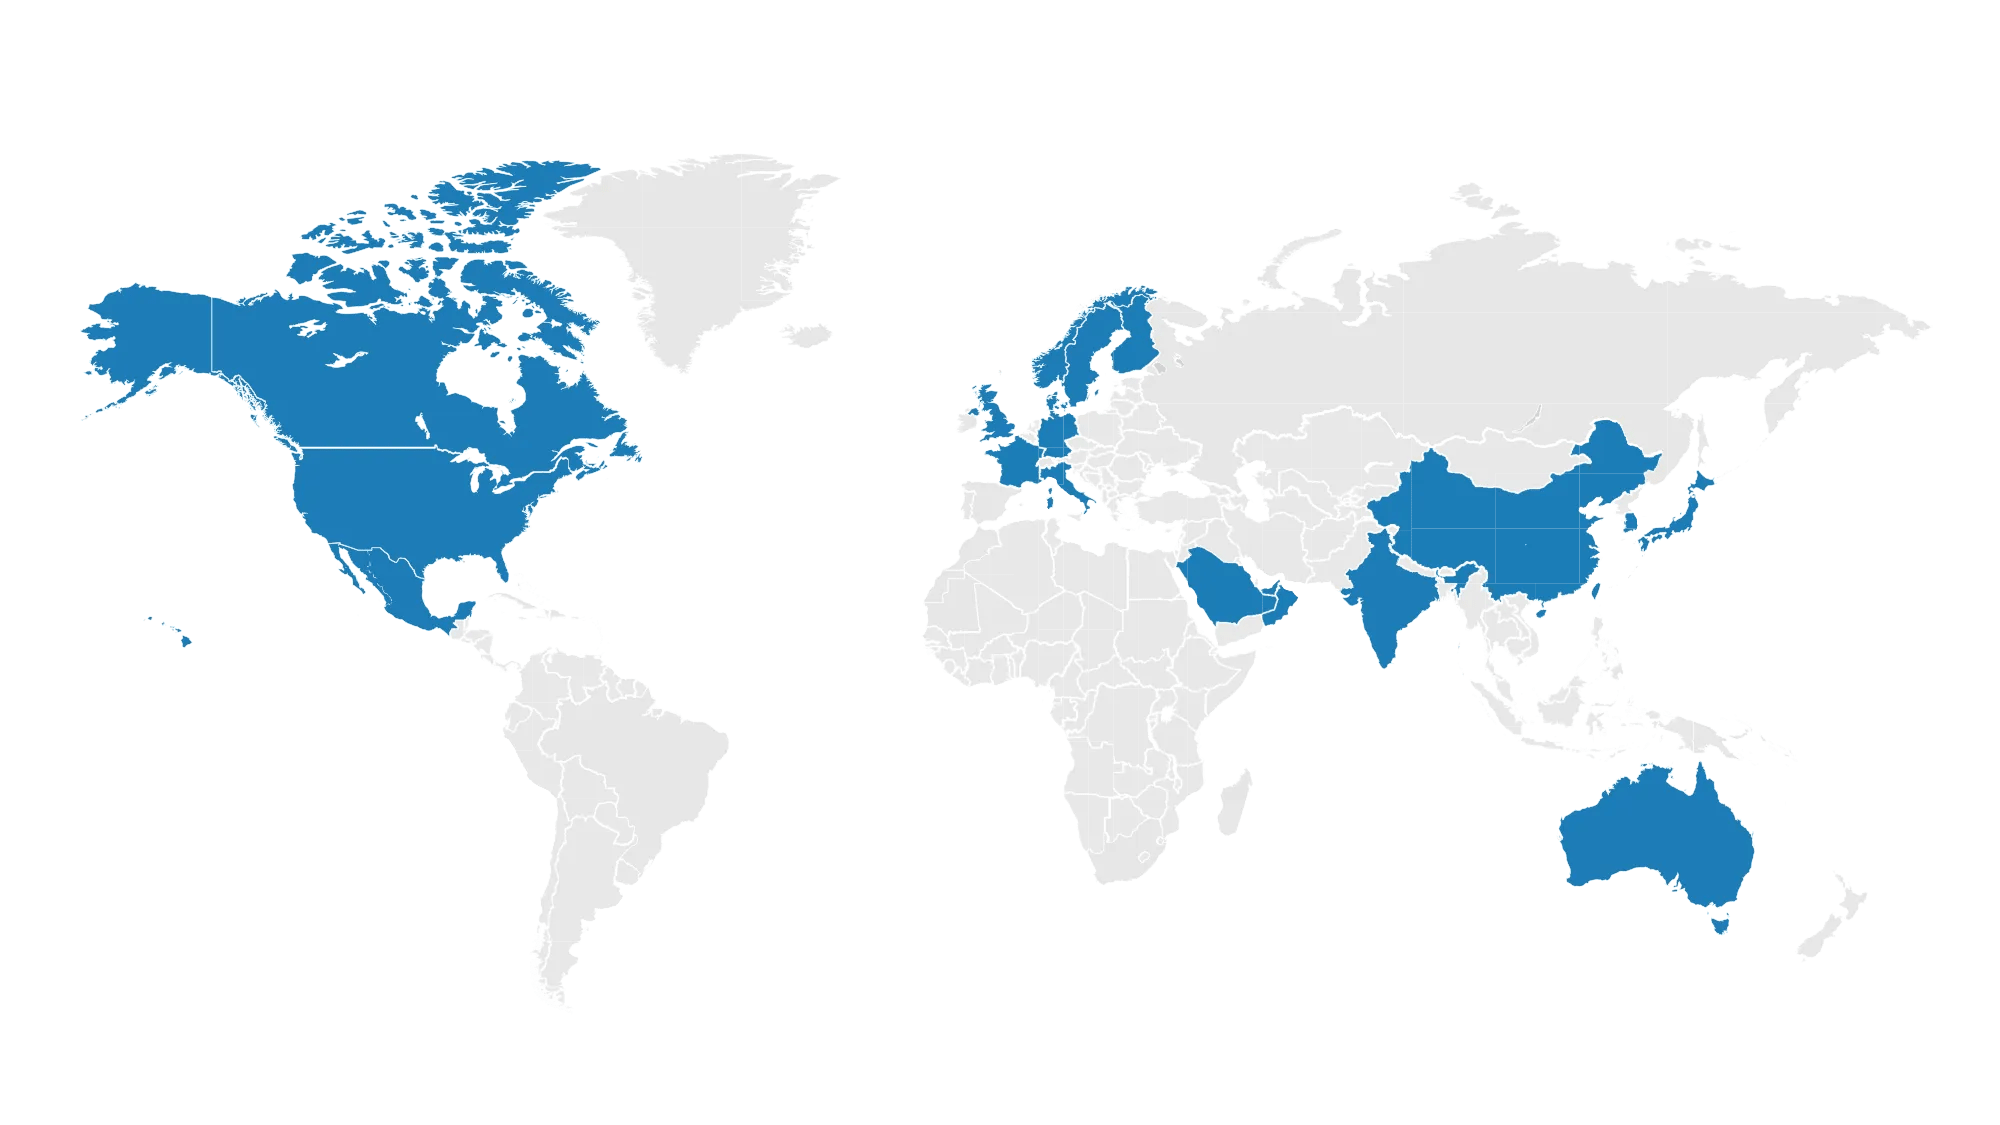
Discover research for California's top global markets
Back to main menu
Our impact
Marketing campaigns
Global brand: The Ultimate Playground
Family travel
Road trips
Professional meetings & events
Luxury travel
Visit Native California
Crisis response
Marketing effectiveness
Global Program Review
Destination stewardship
Travel Matters
Newsroom
Featured
Global marketing delivered $31.5 billion in traveler spending
View the Newsroom blog for the latest program updates
Back to main menu
Resources
Images and video
Brand usage
What's New
Industry Relations
Marketing plans
Public relations resources
Request a speaker
Featured
Industry Relations delivers support to your sector and region
Back to main menu
About us
Our team
Board of directors
Leadership and staff
Committees
Directors of client relations
A shared investment in tourism
Visit California presentations
Public meetings
Careers
Request for proposals
Featured
Industry-funded and -guided program delivers ROI and fiscal efficiency
Site search
Clear
|
Search
Featured searches
Outlook Forum
Global brand
Road trips
Forecast
Sentiment
Marketing plans
Home
Research Catalog
Reports
Back to home
Reports listing
Overview
Listing
Let's get that for you